
Figure 1:All ladders do something interesting: They divide vertical space in discrete, countable steps with nothing (but air) in between. The result is that we can count height in steps we take up or down. Ladders thus apply an (arbitrary) scale of sorts to height and thus provides countable units that we can add, divide, and so on. What does that have to do with the science of perception? There is an intriguing analog that has revolutionized how we think of the measurability of conscious experience.[1]

Figure 1:All ladders do something interesting: They divide vertical space in discrete, countable steps with nothing (but air) in between. The result is that we can count height in steps we take up or down. Ladders thus apply an (arbitrary) scale of sorts to height and thus provides countable units that we can add, divide, and so on. What does that have to do with the science of perception? There is an intriguing analog that has revolutionized how we think of the measurability of conscious experience.[1]
Motivation
Before we discuss each of our senses in detail, we first need to take a brief historical detour. The reason for that is an interesting one.
Much of what we will discuss in the context of the science of perception will be anything but. For example, we will discuss the physics of light, sound, and mechanical force as well as the chemistry of odorants and gustation. These are all stimuli of our environment that we can sense. However, by themselves they do not lead to perception: According to physics, light inside a room inside a vacated home exists no matter whether there is someone perceiving it or not.
We then will discuss how our bodies sense these stimuli, such as how photoreceptors react to light. But that, too, seems to have little to do with perception. After all, we can have visual experiences at night in a dark room with eyes closed when we dream. And on the flip side, we seem to not perceive anything even with our eyes open when we are unconscious because we fainted or undergo general anesthesia.
You might suspect that perception is more closely linked with what your brain does after it receives information from your sense receptors, and that is correct. But, as well see, even this line of inquiry does not get very far - all we will be able to find are brain mechanisms that correlate with perception, such as neurons or areas that increase or decrease in activity whenever we have a certain perceptual experience.
For this reason we will also review what is known about the psychology of perception, with the ultimate goal to find a link between how perception presents itself to us and the brain mechanisms that support it. But this is where a problem arises.
How can be scientific about perception? How can we measure it? Put numbers on it?
At first sight it seems that perception is “too subjective” for “objective” measurement. And in fact, this was the prevailing view of scholars for long periods of history. Some of that skepticism persists. You can still buy stickers online that proclaim “You cannot measure love.”, suggesting that feelings (which we defined to be perceptual experiences about our own mental state) are fundamentally unmeasurable. That seems inuitive, but as we will see, it is incorrect.

Figure 3:Measurement is essential for exact science. But (how) can we precisely measure perception? [2]
Can you measure love?
Imagine your best friend tells you that they have recently fallen in love. Asking them: “That is wonderful. How much?” will likely just evoke a confused smile.
But is it really an unanswerable question? After all, it may make sense that they have fallen in love before and that the experience is not the same this time.
It is not unheard of that people who find “the love of their life” experience that their love for this person is greater than what they have felt before.
In the same vein, some parents experience that their love for their children leads them to a previously unexperienced form of love: Many parents would gladly lay down their lives for ther children and have not felt that before. This is not to take away from the love they feel for other people, of course. It just seems that they experience even more love for their children.

Figure 4:Is it really true that “You cannot you measure love?” [3]
And what is measurement other than assessing “more”, “less”, or “the same”? Numbers seem to make this process just a bit more precise.
Still, you might feel hesitant to judge what someone perceives by them assigning numbers to it. Not only is perception “subjective”, but assigning a value seems “subjective” as well.
Perhaps surprisingly, we have learned that neither seems to be a fundamental problem. In fact, we make life-or-death decisions based on such self-assigned numbers to perceptual experiences. But before we get to that, we first need to follow the historical arc that led to such a drastic outcome.
History
The finding that we can make precise measurements of perception only goes back to 1850. On October 22 that year, Gustav Theodor Fechner made an entry in his diary that he had a conceptual breakthrough. We are still making use of that insight today, including people that have made millions of dollars based on it.
So, what Fechner did find?
His insight is best understood by a thought experiment:
Imagine you are blindfolded. You are stretching out one of your arms. Someone places a small, thin sheet paper on it. Can you feel it?

Figure 5:Imagine being blindfolded with the aim to feel changing weights in your hands. [4]
Now imagine that the other person silently places a large feather on your hand with the paper on it. Your task is to speak up when you feel that extra weight. If you think that you could probably detect that change in weight, you are probably right.
But now imagine that that person neatly placed 100 feathers on top of the paper. So, your hand now feels quite a bit heavier. And the task is now to detect a single extra feather. Would that be possible? What if we start with 500 feathers? Or 5000? Would you still be able to feel when a single extra feather is added? If your intuition is that this would be harder, if not impossible, you are correct.
This seems trivial. But Fechner realized that something very interesting happened here.

Figure 6:How many feathers can a blindfolded person tell apart if they are slowly added to a plate they hold in their hand?[5]
Let us imagine that when we added the first feather you sensed a difference in weight. And we already established that once there are many (hundreds or thousands of feathers), you cannot sense the same difference in weight. What this means is that if we imagine that we just add one feather at a time and your task is to detect and say when that happened, we will go from you sensing every physical change (each added feather) to - at some point - *having the same (constant) perception despite the physical stimulus increasing.
Again, this may seem trivial, but we are not quite done yet. Now, imagine that we added so many feathers to your hand that you do not feel anymore when a single feather is silently added. But if we keep adding feathers, at some point you will! After all, only because your hand feels heavier now and you cannot feel a single feather being added anymore does not mean that you lost all sense of weight. Maybe we need to add 10 more feathers or 100, but at some point you will say “Now it feels heavier again”.
Taken all this into account, Fechner realized that often we fail to detect small changes of physical stimuli, such as the added weight of a feather when our hand already holds up something slightly heavier. And that this state of feeling the same despite the stimulus changing can persist across several steps of physical changes, such as adding yet another feather. We call this state of affairs being at “subjective equality” - no matter the fact that the physical stimulus is getting heavier, you feel all these weights as subjectively equal.
Now, even more interesting is what happens next: The moment we add so many new feathers that you eventually feel an increase in weight. This is a threshold. That is, we finally crossed a threshold of adding weight that broke you out of subjective equality.
Thresholds
Why is this a big deal? Remember that we started out by pondering that we cannot put numbers of perception (such as love). But a threshold allows us to do just that! You went from 0 (no change/feels the same) to 1 (feels like “more”). And this is not just an arbitrary “step”. The “more” that you feel once we pass the threshold is the minimal amount of “more weight” that you can feel under these circumstances. After all, if there would have been a smaller increment, you would have felt that. But instead, you felt no change.
Do you see why Fechner got excited? He just solved the problem. We can put numbers on our perception, they are not arbitrary but measure minimal perceptual increments, and we can do all that using experiments. All we have to do is to precisely measure when these thresholds occur - the respective change in physical stimulus is called the just-noticeable difference, or JND.
But there is more. We can also find out when you go from perceiving nothing to perceiving something using the same technique. This is just another threshold. For example, we can play very faint sounds or use very dim lights, make them stronger and find out when you hear or see the stimulus. These thresholds (the minimal stimulus intensities that you can perceive) are called absolute thresholds since they are believed to be more or less unchanging for the same individual (different people, such as when testing the faintest sound young or old people can hear, have very different absolute thresholds, of course). Stimuli that are just above the absolute threshold are called just noticeable stimuli. Different people tested at different times will have different absolute thresholds.
In contrast, the thresholds that occur when we start out with you already perceiving a stimulus (such as the weight of a single feather), and ramp up the stimulus intensity (e.g., buy adding more feather) are called relative thresholds. That implies that may not be a constant, but instead what we experience as a relative threshold depends on what we just experienced. However, this does not imply that relative thresholds are random. Instead, they follow a rule (which we will discuss in the next section). Showing that this context-dependence is not arbitrary was Fechner’s second major breakthrough. Stimuli that pass a relative threshold (and thus evoke a change in perception) are called just noticeable differences, or JNDs.
The measure of a JND is crucial for mathematizing perception. Since our perception is unchanged if we change a stimulus just barely so that it remains below a relative threshold means that our perception “jumps” in discrete steps, where each step up is a JND. In other words, perception seems to have units in which it increases in magnitude. We can count these steps and assign numbers to them. The result is a staircase of sorts, where our perception is “flat” (unchanged) for small stimulus changes and then “steps up” at each relative threshold and thereby increases by one JND.
When we slightly change a stimulus and we do not experience a difference in our perception (despite the physically changed stimulus), we call these “flat” parts of the staircase points of subjective equilibrium, or PSE. This is just a fanciful label for describing that our perception is unchanged, even though we changed stimulation.
This all might sound a bit convoluted (and certainly is quite a bit of jargon), which might distract from the fact that what we are describing is quite simple and straightforward, perhaps even a bit trivial. The easiest way to demonstrate what we just described is via illustration:
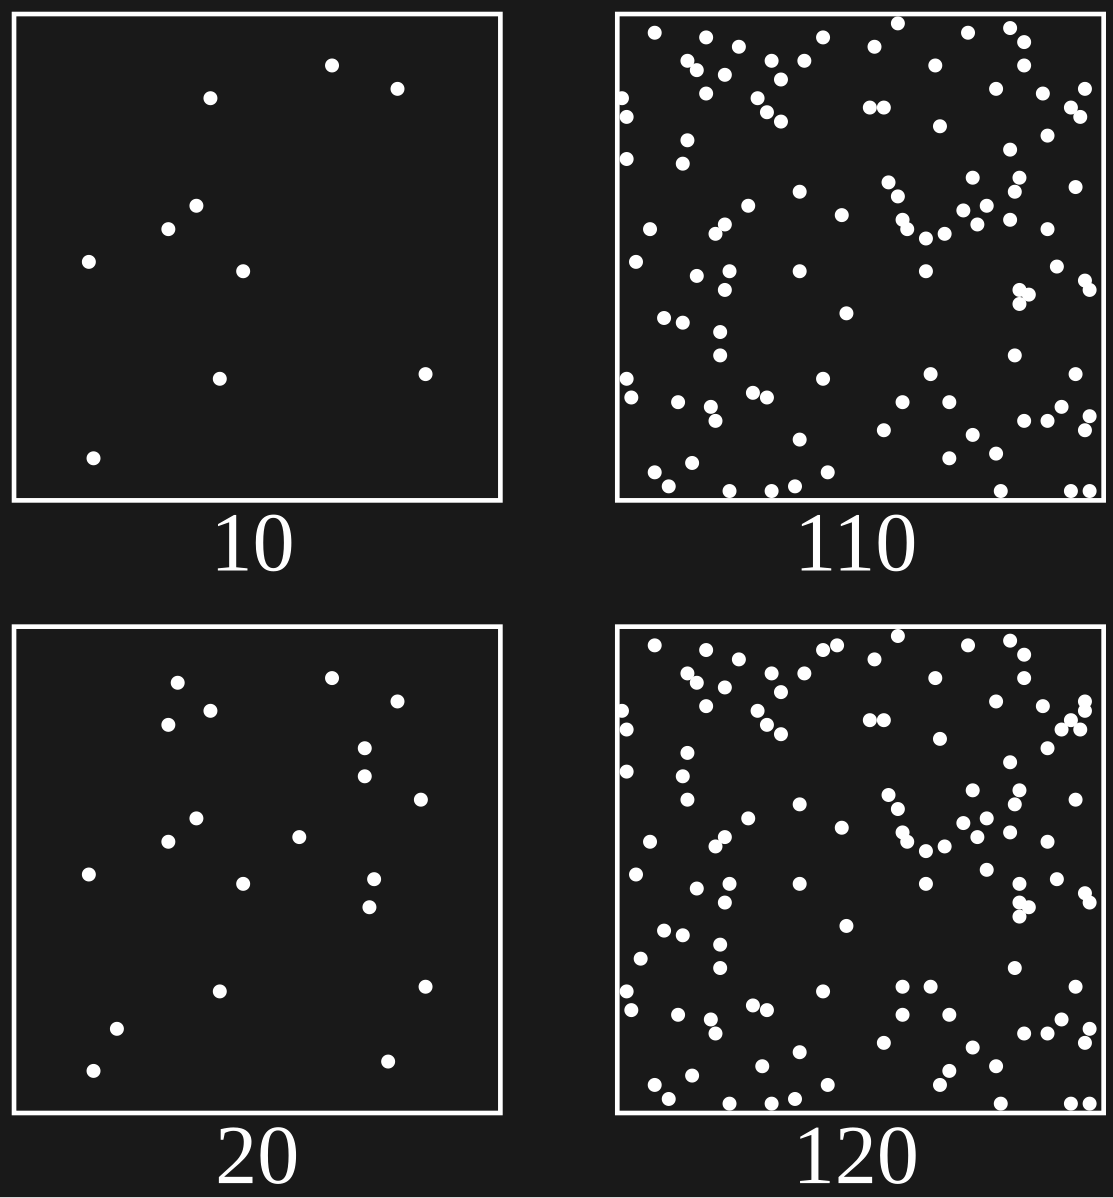
Figure 7:The leftmost images show 10 and 20 dots, respectively. We can immediately tell that the bottom image shows more dots (a higher quantity) than the one above. Psychophysically speaking, the two images must be two stimuli separated by one or more just-noticeable-differences (JNDs) for us to be able to tell that they are different (in amount of dots). However, the rightmost two images look like they are of the amount - even though the bottom image again features 10 dots more than the image above. Psychophysically speaking, these two images fall inside a point of subjective equality (PSE). That is, we experience them as being of the same amount, despite the fact that the actual physical amount differs (interestingly enough by the same amount, 10 dots, that we were able to immediately detect as added).[5]
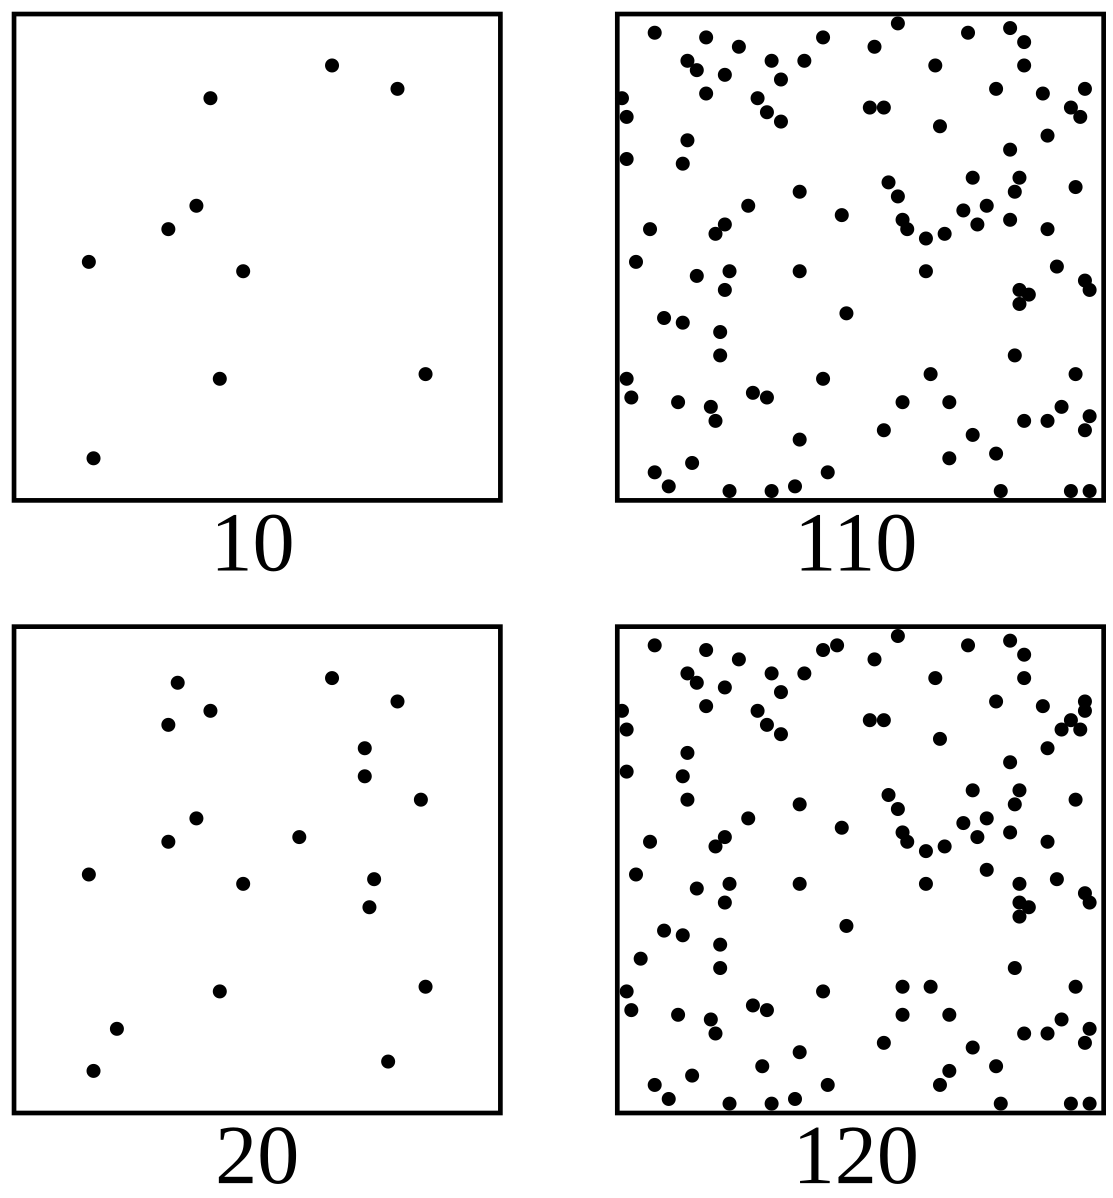
Figure 7:The leftmost images show 10 and 20 dots, respectively. We can immediately tell that the bottom image shows more dots (a higher quantity) than the one above. Psychophysically speaking, the two images must be two stimuli separated by one or more just-noticeable-differences (JNDs) for us to be able to tell that they are different (in amount of dots). However, the rightmost two images look like they are of the amount - even though the bottom image again features 10 dots more than the image above. Psychophysically speaking, these two images fall inside a point of subjective equality (PSE). That is, we experience them as being of the same amount, despite the fact that the actual physical amount differs (interestingly enough by the same amount, 10 dots, that we were able to immediately detect as added).[6]
Let’s go back to our thought experiment. We established that if you hold your hand out, and we put the light weight of a piece of paper on top of it, you will likely feel the weight of a single feather that we lay on top of the paper (if you cannot imagine that, just imagine it being 10 feathers at once). Now imagine that we put several very big hardcover books on your hands and add the feather (or 10 feathers) again. Would you be able to feel that? No. Clearly. So, the threshold of, say a single (or 10) feathers now does not work anymore. We need a lot more feathers on top of the books before you feel the extra weight.
Fechner’s Law
Fechner went to work and tested exactly that. Rather than a thought experiment, he tested what the exact weights were that blindfolded people could detect. And he realized something astonishing: The relative thresholds increased proportionally to the weight that the person already had in hand.
Let us take a moment and ponder that. Fechner did not only show that we can measure (changes in) perception numerically, but that if we do so, the result follows a mathematical law!
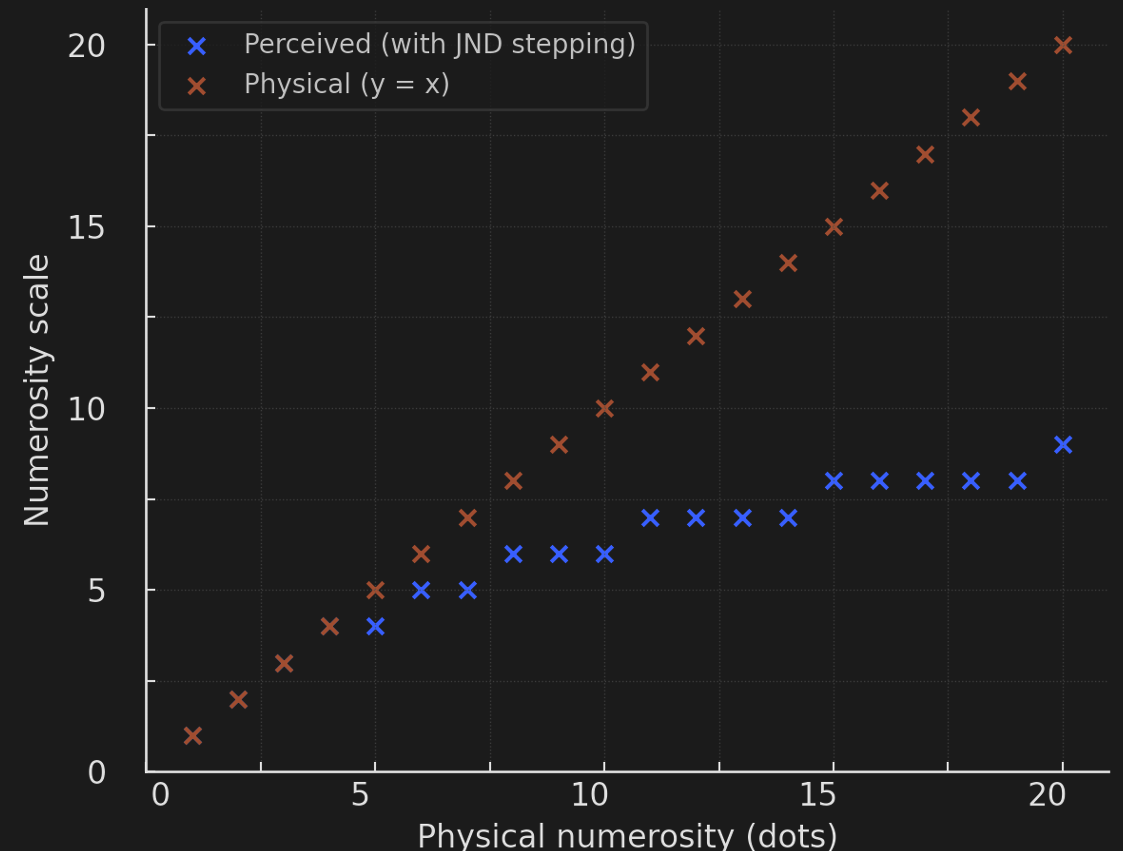
Figure 9:Psychometric Function for numerosity.
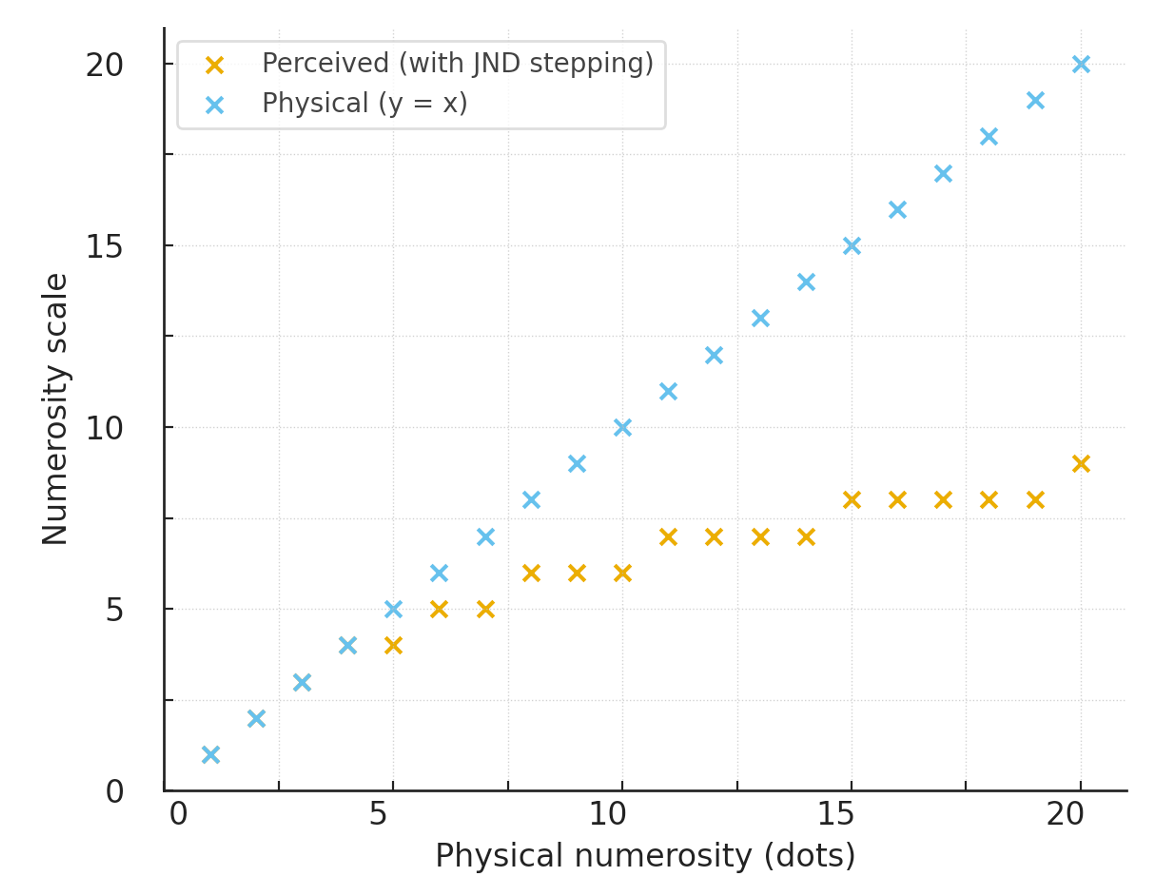
Figure 9:Psychometric Function for numerosity.
And that law takes the mathematical shape of a logarithm:
where S is the perceived magnitude I is the physical stimulus I0 is the minimally detectable stimulus k is a constant that changes depending on the type of sense or stimulus
There is a mathematically precise law that allows us to predict how perception changes as we increase or decrease the strength (magnitude) of a physical stimulus. And that relationship, or mapping, between physical stimuli and perceptual experience is logarithmic (in most cases - we will discuss exceptions later).
Fechner realized that this meant that perception seemed to follow “laws of nature”, just like the classical Newtonian physics that he was familiar with. That is, we can describe perceptual measurement with equations, just like we can describe motion with equations (such as F=ma). Fechner thus called his approach Psychophysics since it really seemed to be a “physics of the psyche” in that it is an approach of precise measurement resulting in lawful relations (and hence predictions).
Methods
You might feel a bit concerned at this point that, while we celebrated a mathematically rigorous law (Fechner’s Law), we seemingly started without a rigorous experimental approach. After all, we just imagined a scenario where someone is blindfolded, we change the physical stimulus and await a response. But what if that person is lying (perhaps just because they find that funny)?
Psychophysics found clever ways around that potential problem. So, let’s talk about that next.
There are three “classical methods” that we will discuss first. After that, we will discuss some clever extensions that have become feasible thanks to additional mathematics and computer technology that further minimize unreliable data from untruthful - and even from just slightly biased - observers.
Method of Constant Stimuli
This technique is the most straightfoward. We prepare a set of stimuli of varying intensity (such as different weights), and randomly present them to a voluntary participant. Then, we determine which stimuli were above or below the absolute threshold of detection in order to determine the minimal detectable stimulus, or just detectable stimulus. In order to obtain reliable data, we can repeatedly present the stimuli to determine an average.
Method of Adjustment
This technique is distinguished by the participant changing the stimulus themselves.
Method of Limits
This technique does not used fixed stimuli, but instead an experimenter gradually (non-randomly) increases or decreases the intensity of a stimulus until a change is detected.
Extensions
The most popular technique in modern research is arguably the Method of Limits. The main reason for this choice probably lies in the fact that computers have made it easy to automatically adjust stimuli following a participant’s response. Another reason for the popularity of this psychophysical technique lies in the fact that when the Method of Limits is used in combination with other techniques, the result is both increased rigor (precision) as well as heightened confidence in the report of subjects. How is that possible?
Staircase Design
The first most common extension of the Method of Limits is called a staricase design. As the name suggests, this technique rests on a “staircase” of sorts in which stimuli are chosen at each step to be presented next. In other words, each stimulus is chosen to be either one slight amount larger or smaller (or less or more intense) than the previous stimulus, depending on - and this is important - the report of the observer/study participant. The result is a starircase that goes up, then down, then up, and down again and so on.
What is the point of all that? The main idea is to move stimuli around the threshold (which could be absolute or relative) in question. If stimuli are below a threshold, a staircase technique “steps up” in stimulus intensity until the threshold is reached, then goes on a bit more to ensure that the threshold has been crossed, and then reverses direction and “steps down” until the threshold is crossed again.
You can probably see how this technique allows for very precise measurements
as we can adjust the “step size” to become smaller and smaller in the process.
Two-Alternative Forced Choice (2-AFC)
The second extensional technique that enhances precision and rigor in psychophysics is to severely limit what a study participant can report at any point in time. The most common experiment of this kind uses two main components:
participants have to report when prompted
participants have to respond using just one of two possible choices (e.g., yes or no). We call the resulting experimental design: two-alternative (since there are only two alternatives, such as yes or no) forced choice (since one of the two choices has to be picked; there is no option to obstain). Two-alternative forced choice (commonly abbreviated to 2-AFC) is one of the most common experimental techniques in all of experimental psychology, and not just psychophysics. The main reason for this popularity lies in the fact that it allows for a simple, but useful data analysis technique that we will discuss in the next section.
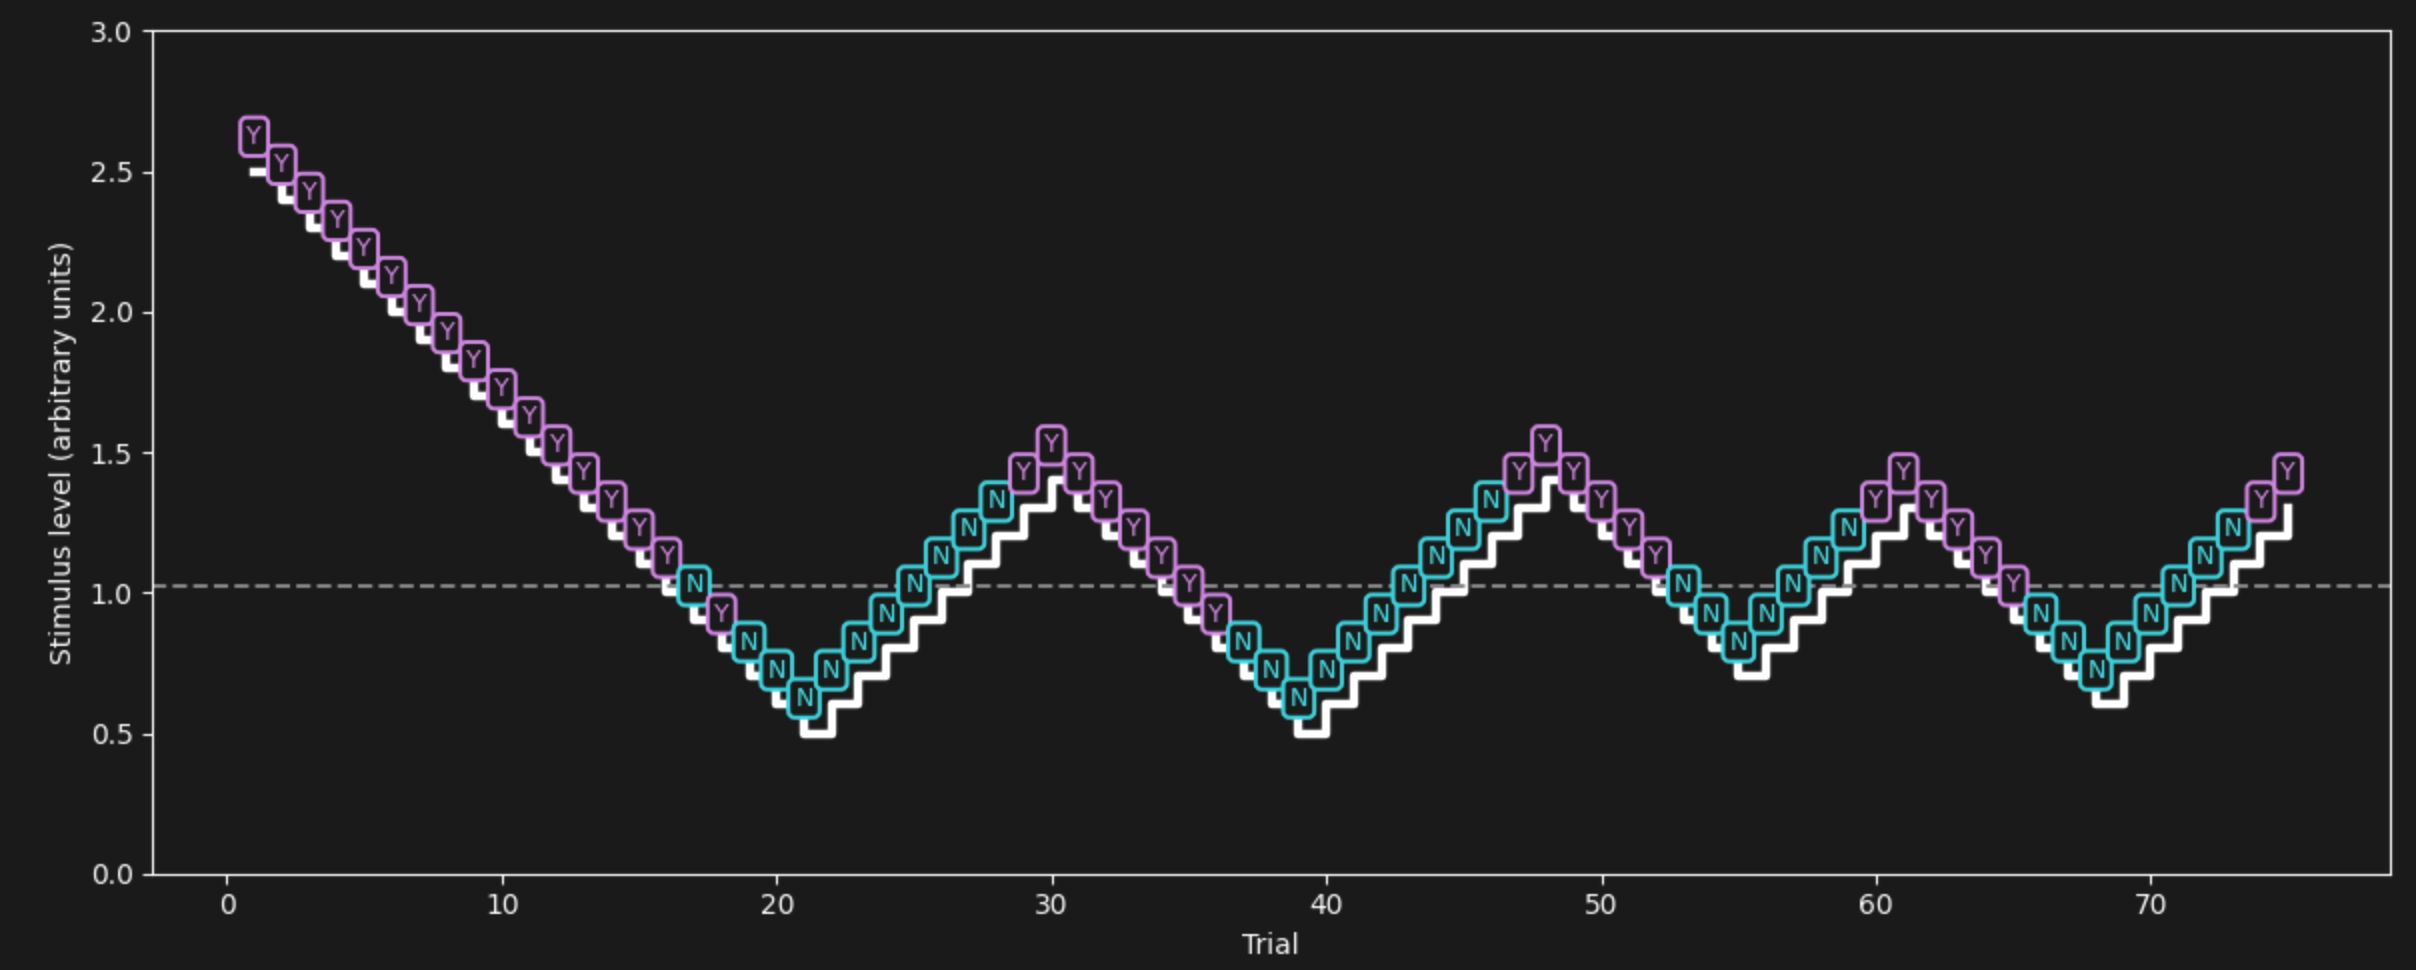
Figure 11:Staircase Design for measuring psychophysical thresholds. Each box shows a single stimulus presentation, followed by a yes (Y) or no (N) response. When the response was negative (Y), the stimulus gets reduced in intensity until the response turns negative (N) several times in a row, indicating that the threshold got crossed. In that case, the stimulus intensity is raised again. Once the threshold is crossed again, responses will turn positive (Y) again. This triggers a reversal of stimulus intensity again. This ascending and descending pattern is repeated until the 50% Y/N threshold can be computed as an average (mean).
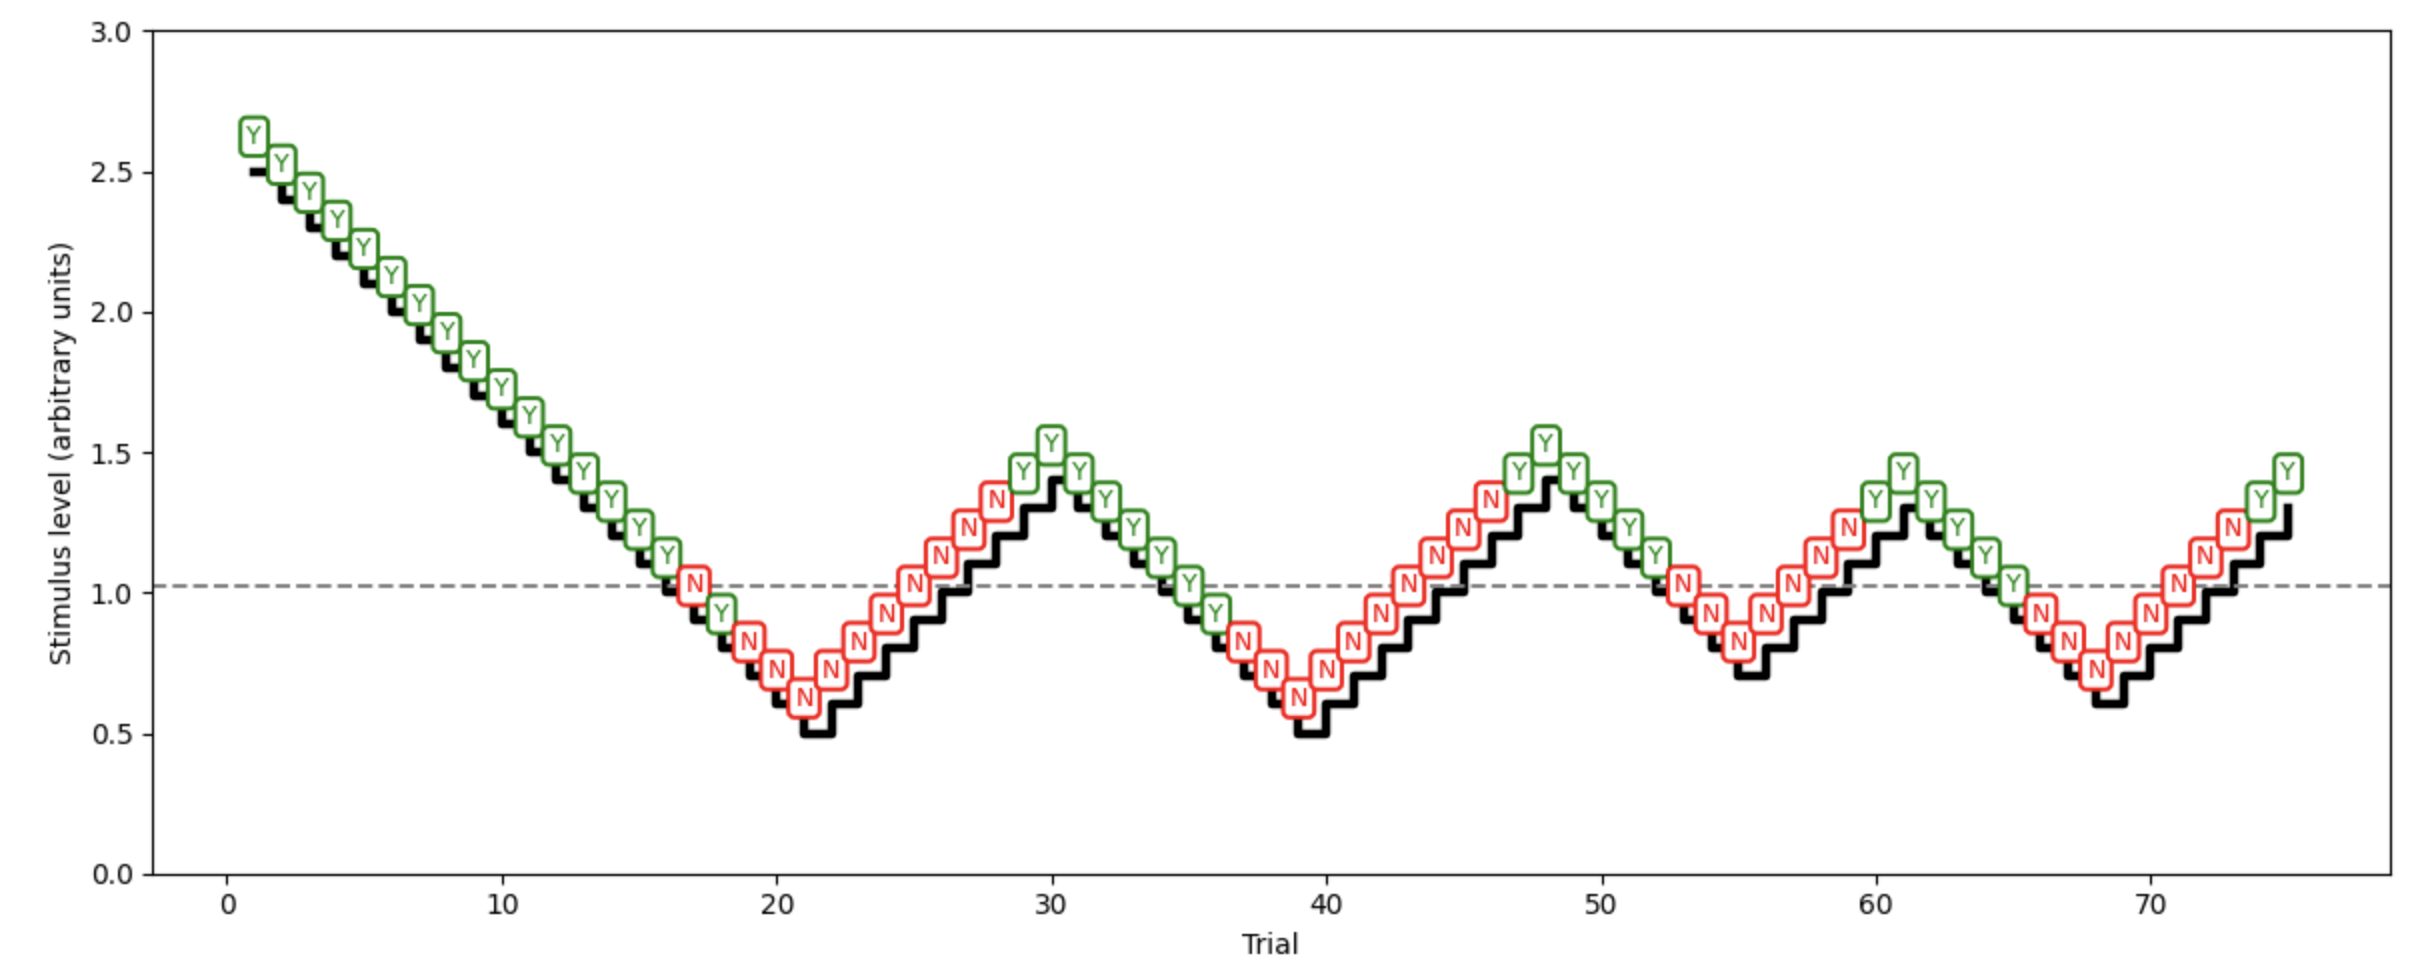
Figure 11:Staircase Design for measuring psychophysical thresholds. Each box shows a single stimulus presentation, followed by a yes (Y) or no (N) response. When the response was negative (Y), the stimulus gets reduced in intensity until the response turns negative (N) several times in a row, indicating that the threshold got crossed. In that case, the stimulus intensity is raised again. Once the threshold is crossed again, responses will turn positive (Y) again. This triggers a reversal of stimulus intensity again. This ascending and descending pattern is repeated until the 50% Y/N threshold can be computed as an average (mean).
Signal Detection Theory
There is a lot to say about Signal Detection Theory, or SDT. But the only important fact about it in our context is that it can be used to quantify the bias of study participants when it comes to reporting their perception - particulary when a 2-AFC experiment was used.
The basic idea is the following:
If a study participant is more biased towards saying “yes” when they are not quite sure, this implies that they will do better in detecting an actual stimulus or an actual change in a stimulus under difficult conditions (i.e., a faint stimulus or a slight change). We call this correct detections hits.
However, if we sometimes confront that observer with a condition for which we know the correct answer should be “no” (i.e., we do not present a stimulus, or we do not present a change in the stimulus), they will now also be more likely to say “yes”. After all, to them this may just seem as another challenging condition, and they are leaning towards saying “yes” in that case. We just “caught” them in doing so, and we thus call such presentations (where there is no stimulus or no physical stimulus change) a catch trial. And we call these incorrect detections false alarms.
Note how someone who is more prone to answer “yes” whenever they are in doubt leaves a footprint of sorts in the results (the data) of our experiments: they have a lot of hits and a lot of false alarms. The fact that they do so is a direct consequence of their bias, or report criterion (which causes them to more freely, or liberally apply towards saying “yes”): Imagine someone simply always saying “yes” - they will correctly detect all possible hits in our task, but also incorrectly produce all possible false alarms when we employed catch trials. Someone who is not quite that extrem will just do that to a lesser degree.
Now, let us consider someone doing the exact opposite - and being much more likely to say “no” when they are unsure whether they detected something or not. In jargon, we call someone like that as having a more conservative report criterion in that they are more likely to deny that something has changed (such as there being a stimulus or a physical change to a stimulus). In this case, we find the opposite pattern in the data they produce: Their hits will be diminished since saying “no” more often decreases the chance of correctly detecting a challenging stimulus. At the same time, their false alarms also are decreased since they were more prone to correctly say “no” on those occassions as well. What does go up for someone like that are misses, where they should have detected a stimulus and yet did not do so. At the same time, tehy also excel at correctly indicating that a catch trial took place where there was no stimulus or not stimulus change. We call that event a correct rejection.
Signal Detection Theory provides mathematical formalism that allows for precise quantification of how liberal or conservative someone was in their report criterion when deciding on whether they detected a stimulus (or stimulus change) ubder difficult conditions. The mathematics used to do so is beyond our scope for now, but you can imagine that it must make use of the above by relating an observer’s hits to false alarms.
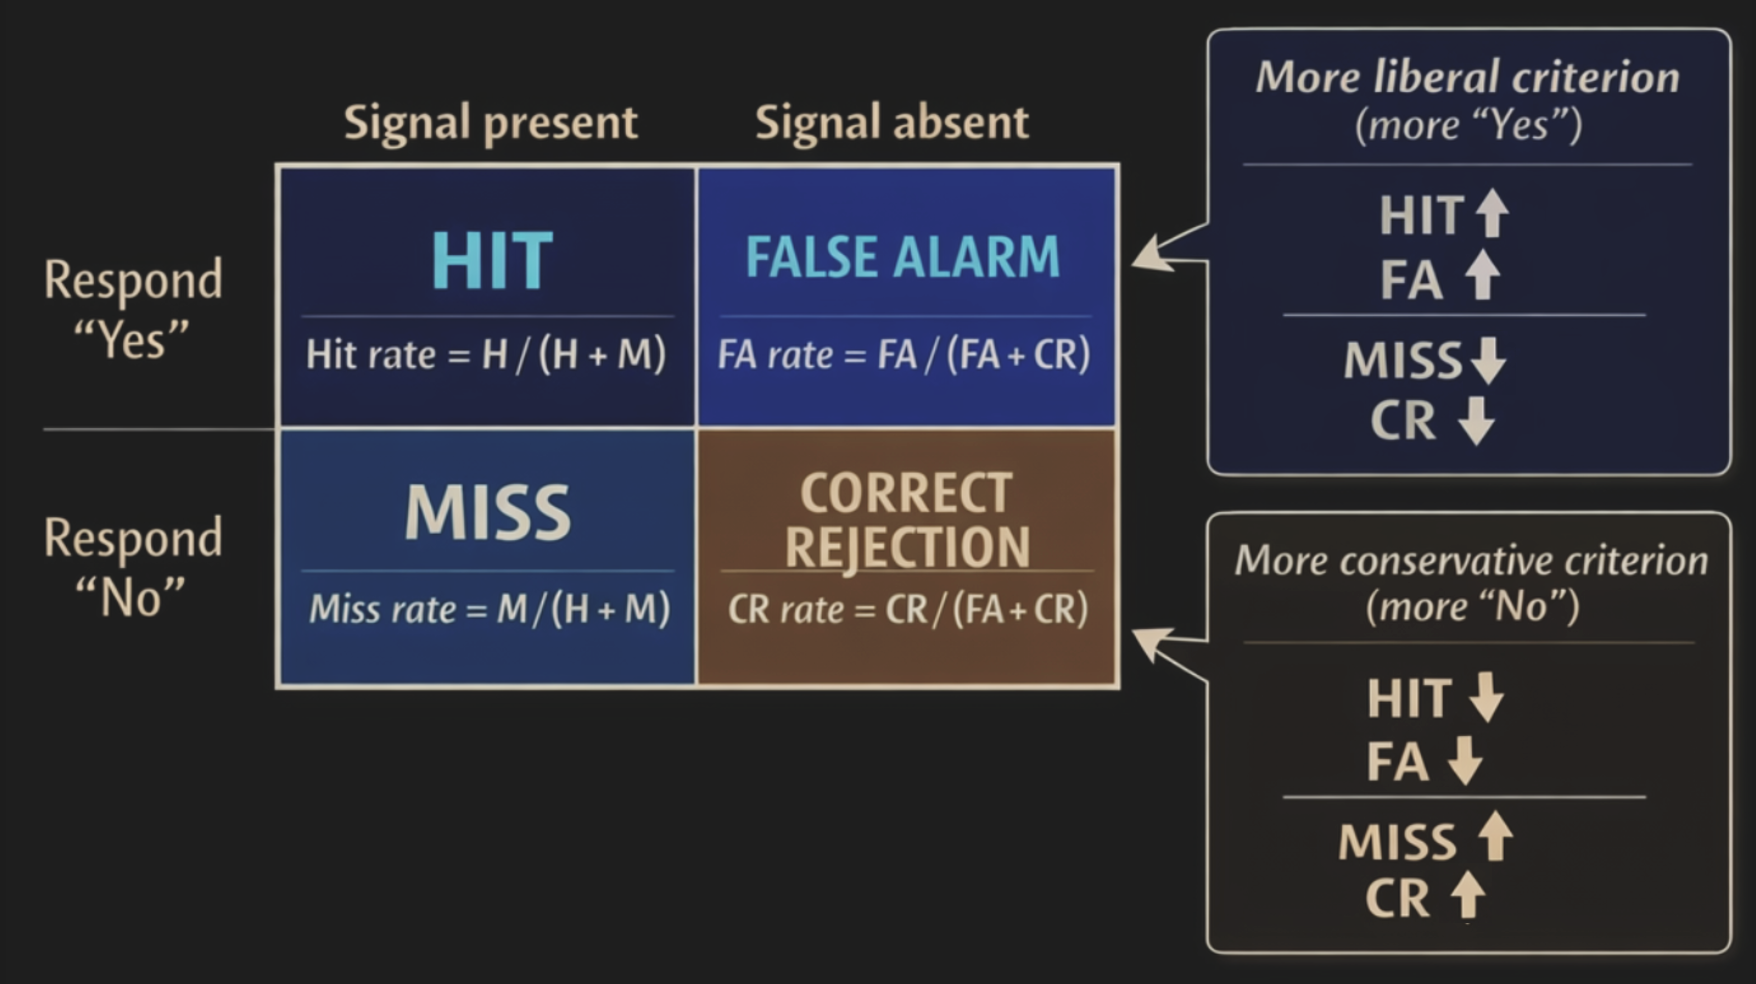
Figure 13:Signal Detection Theory is a mathematical tool to find out whether an observer whose perceptual report we are measuring for (absolute or relative) thresholds is more prone to say “yes” versus “no” whenever they are in doubt because their perception was subtle.
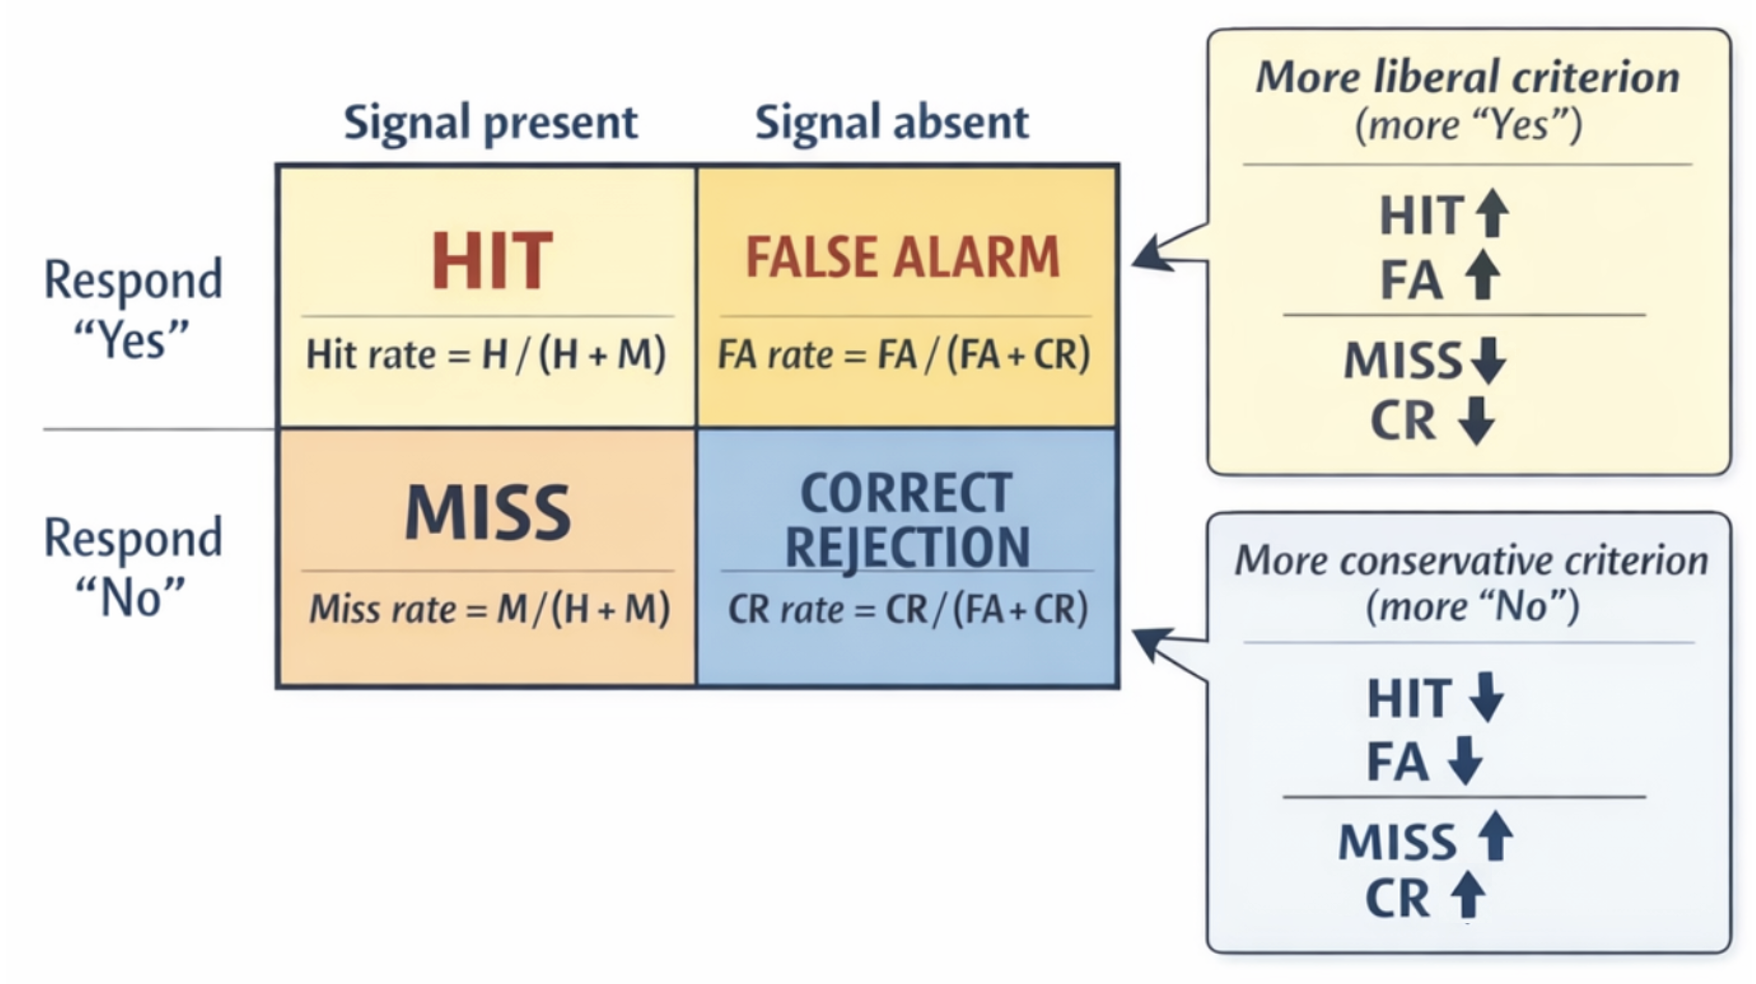
Figure 13:Signal Detection Theory is a mathematical tool to find out whether an observer whose perceptual report we are measuring for (absolute or relative) thresholds is more prone to say “yes” versus “no” whenever they are in doubt because their perception was subtle.
Magnitude Estimation
Following all the above, you might have come to appreciate that psychophysics can provide quite accurate-seeming measures of perception indeed. The basic idea of measuring change as discrete events in the form of thresholds already seems somewhat rigorous and creates a notion of numerosity, or countability of perceptual intensity. Adding to that a staircase method, 2-AFC, and SDT also allows for accounting for potential response bias of study participants, let alone randomly produced or deliberately inaccurate perceptual reports.
Given all that you might feel surprised that several decades ago, some psychophysicists decided to move into the exact opposite direction and drop all rigour (and everything we discussed above). Instead, they wondered, what would happen if we just assume that study participants are able and willing to accurately tell us what they experience. No need for thresholds, catch trials, or any other means of ensuring that we can trust what someone reports about their experience.
Somewhat surprisingly, this avenue has also proven extremely successful, and further provided insights into what we know about perceptual experience.
In the simplest case, this novel way of doing psychophysics amounts to the simple question of asking: How much? or maybe more precisely, asking something like: On a scale from 1 to 10, how much would you say it is?
The answer to these question is called magnitude estimation (of course, these questions can be modified, such as using a scale from 1 to 100 rather than 1 to 10). We can do that for any sense and experience, of course. We can ask how loud someone might rate a sound in this way. We can ask how much they feel that they are in love. Or how much they are in pain, for example.
In fact, the latter (asking someone to rate their intensity of pain experience) is what is most commonly used in emergency room triage, where rapid decisions have to be made about which patient needs the attention of physicians most quickly. In other words, we trust people to make life-or-death decisions using simple psychophysical magnitude estimation.
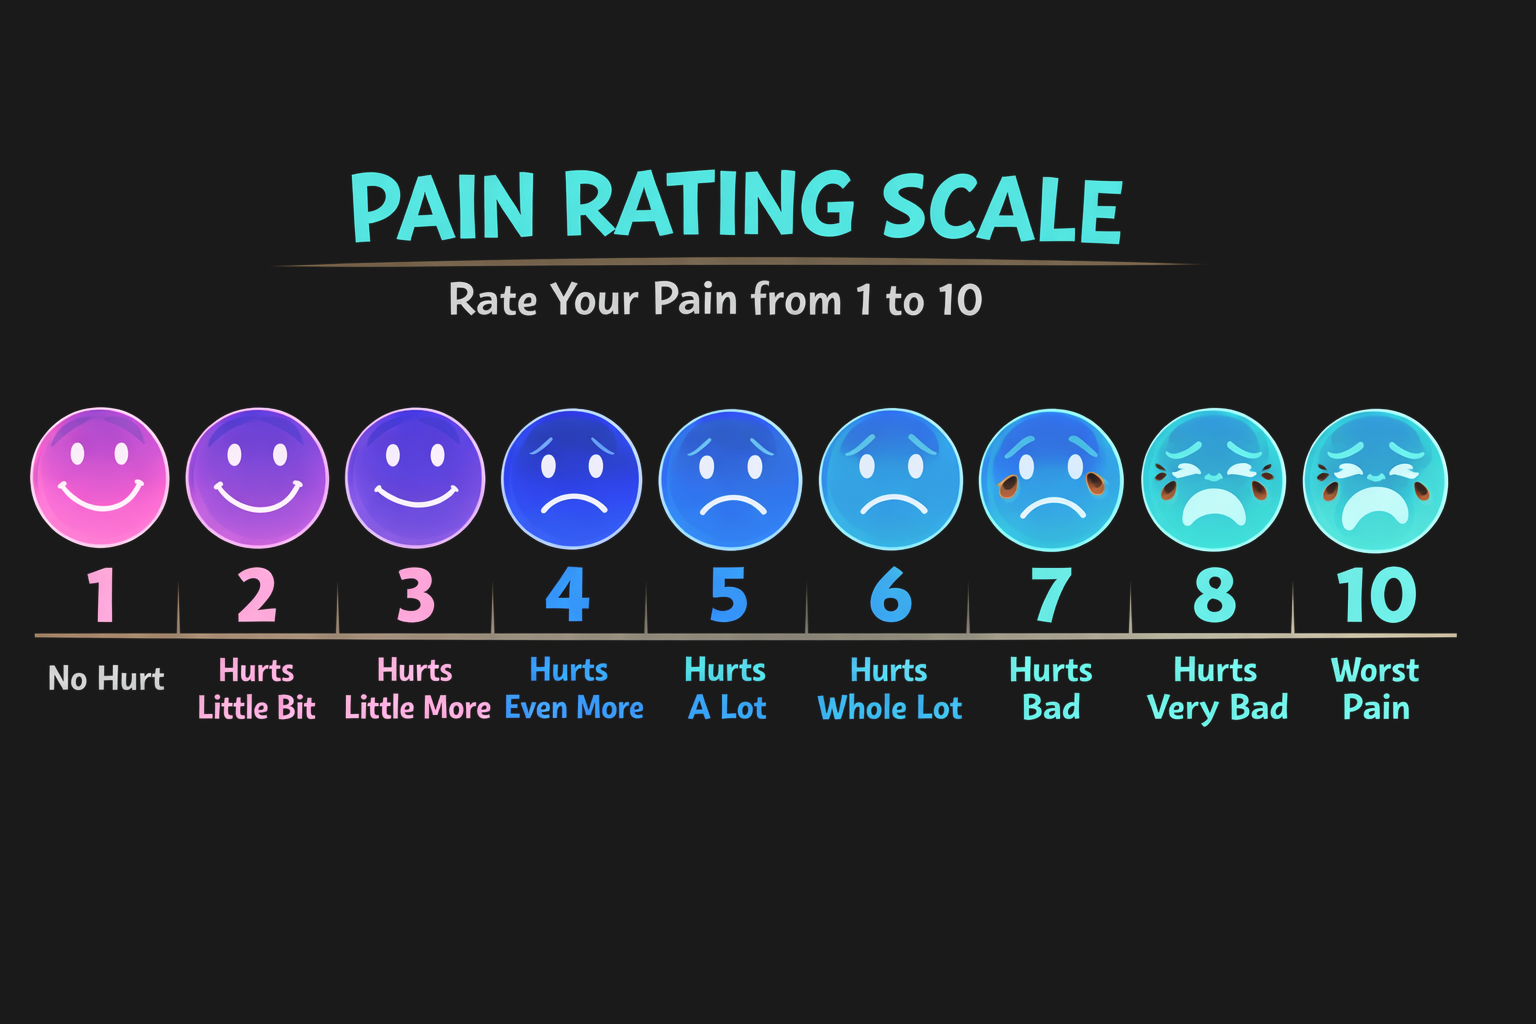
Figure 15:Magnitude Estimation is the technique of having observers directly assign a value to the intensity of their experience, such as describing the level of pain they are in when arriving as a patient at a hospital.
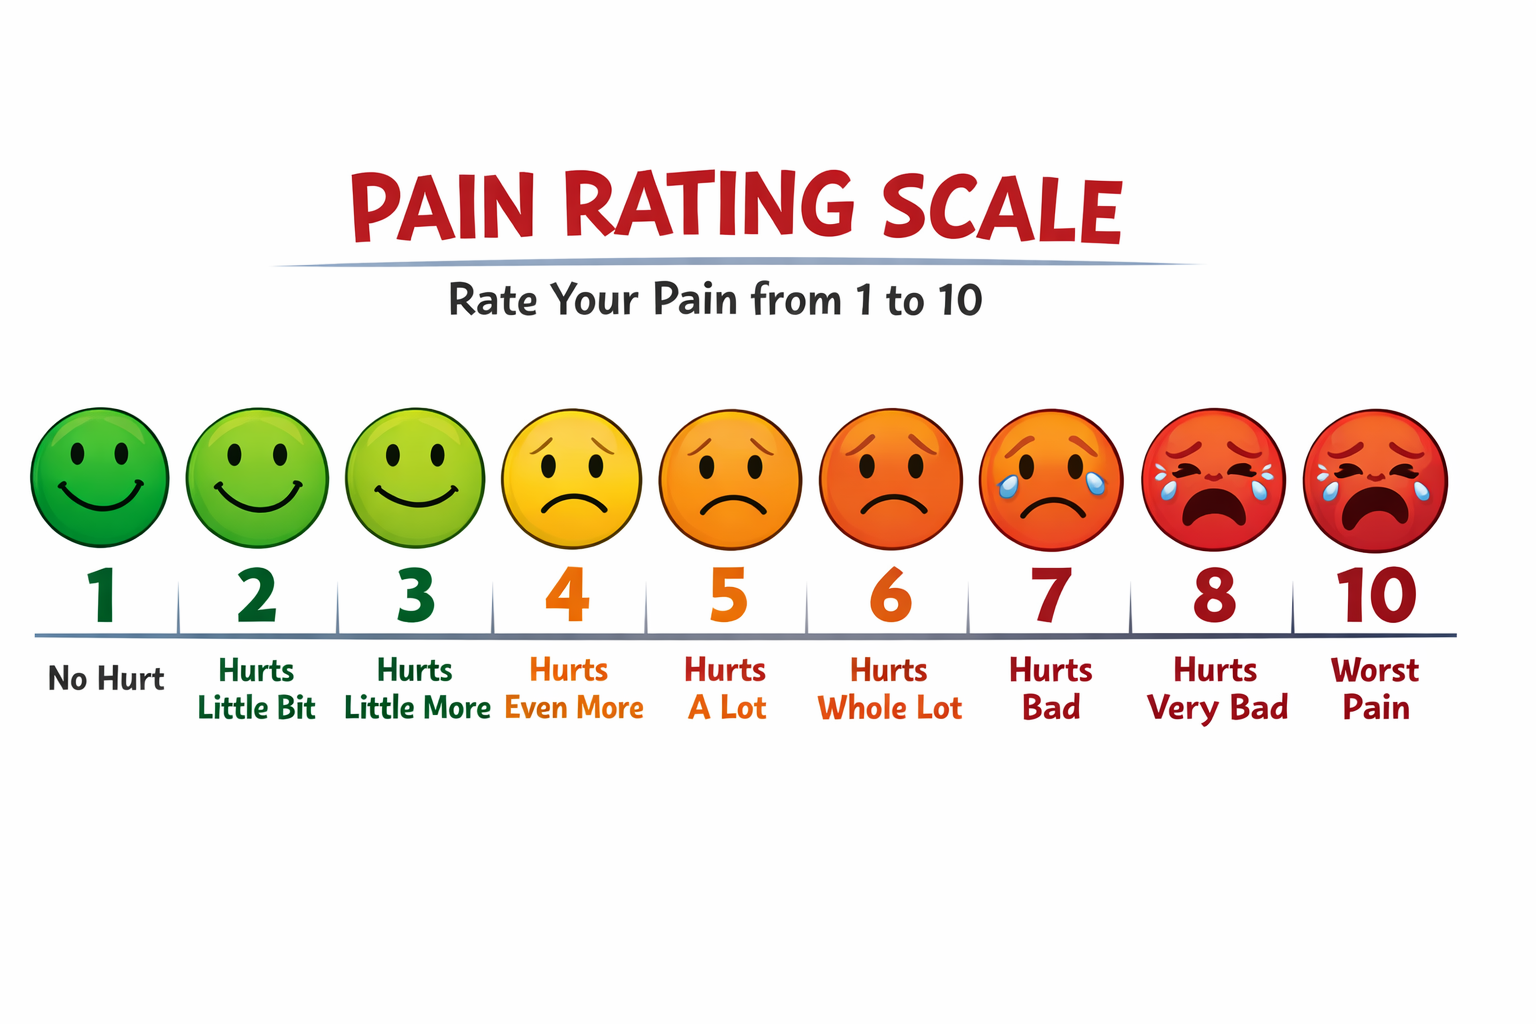
Figure 15:Magnitude Estimation is the technique of having observers directly assign a value to the intensity of their experience, such as describing the level of pain they are in when arriving as a patient at a hospital.
Cross-Modality Matching
Another technique that is closely related to magnitude estimation (and was in fact invented around the same time) is called cross-modality matching. This technique also just asks study participants to rate their experience - except it uses other senses (modalities) as reference points, or comparisons.
So, for example, a cross-modailty matching question might be
Does your pain feel more like the sound of
a silent whisper,
a room full of people at a cocktail party,
standing nearby a heavily trafficked highway?
or an airplane engine?
The main idea is to gain some kind of measure in the sense of = (equal, or about the same), > (larger), < (less), or >> (much larger), << (much less)>>, and so on.
Steven’s Law
One resulting finding of dropping all the rigor that can be gained from measuring thresholds, and using precise techniques, such as staircase designs, 2-AFC and so on, and using just magnitude estimation or cross-modality matching instead is that we now can measure even more. In other words, this extended form of psychophysics now can also measure what may not follow clear thresholds. And the result has been surprising:
Some perceptual experiences do not follow Fechner's Law.For example, the pain elicited by electric shock, which is challenging to measure by classic threshold techniques, is reported by subjects using magnitude estimation to not be logarithmic at all. In fact, the pain that arises by increasingly strong electric shocks follows the exact opposite pattern: it increases exponentially.
And yet, all of these experiences that do not follow Weber’s Law, or Fechner’s Law still follow a law.
Named after the discoverer, Stevens, we now know that there is just one law, or equation, that describes all of these psychophysical curves. That is, one equation - now called Steven’s Law - can account for linear perceptual phenomena (corresponding to Weber’s Law), logarithmic perceptual experiences (corresponding to Fechner’s Law; and by far the most common type of perceptual experiences we have), as well as for the few exponential experiences, such as electric shock:
Note that depending on a, the resulting function will look like the (linear) Weber’s Law, the (logarithmic) Fechner’s Law, or it can even account for exponential curves:
a<1 (compressive growth: Fechner’s Law) Sensation increases more slowly than intensity.
a≈1 (linear growth: Weber’s Law) Sensation tracks intensity proportionally.
a>1 (expansive growth) Sensation increases faster than intensity.
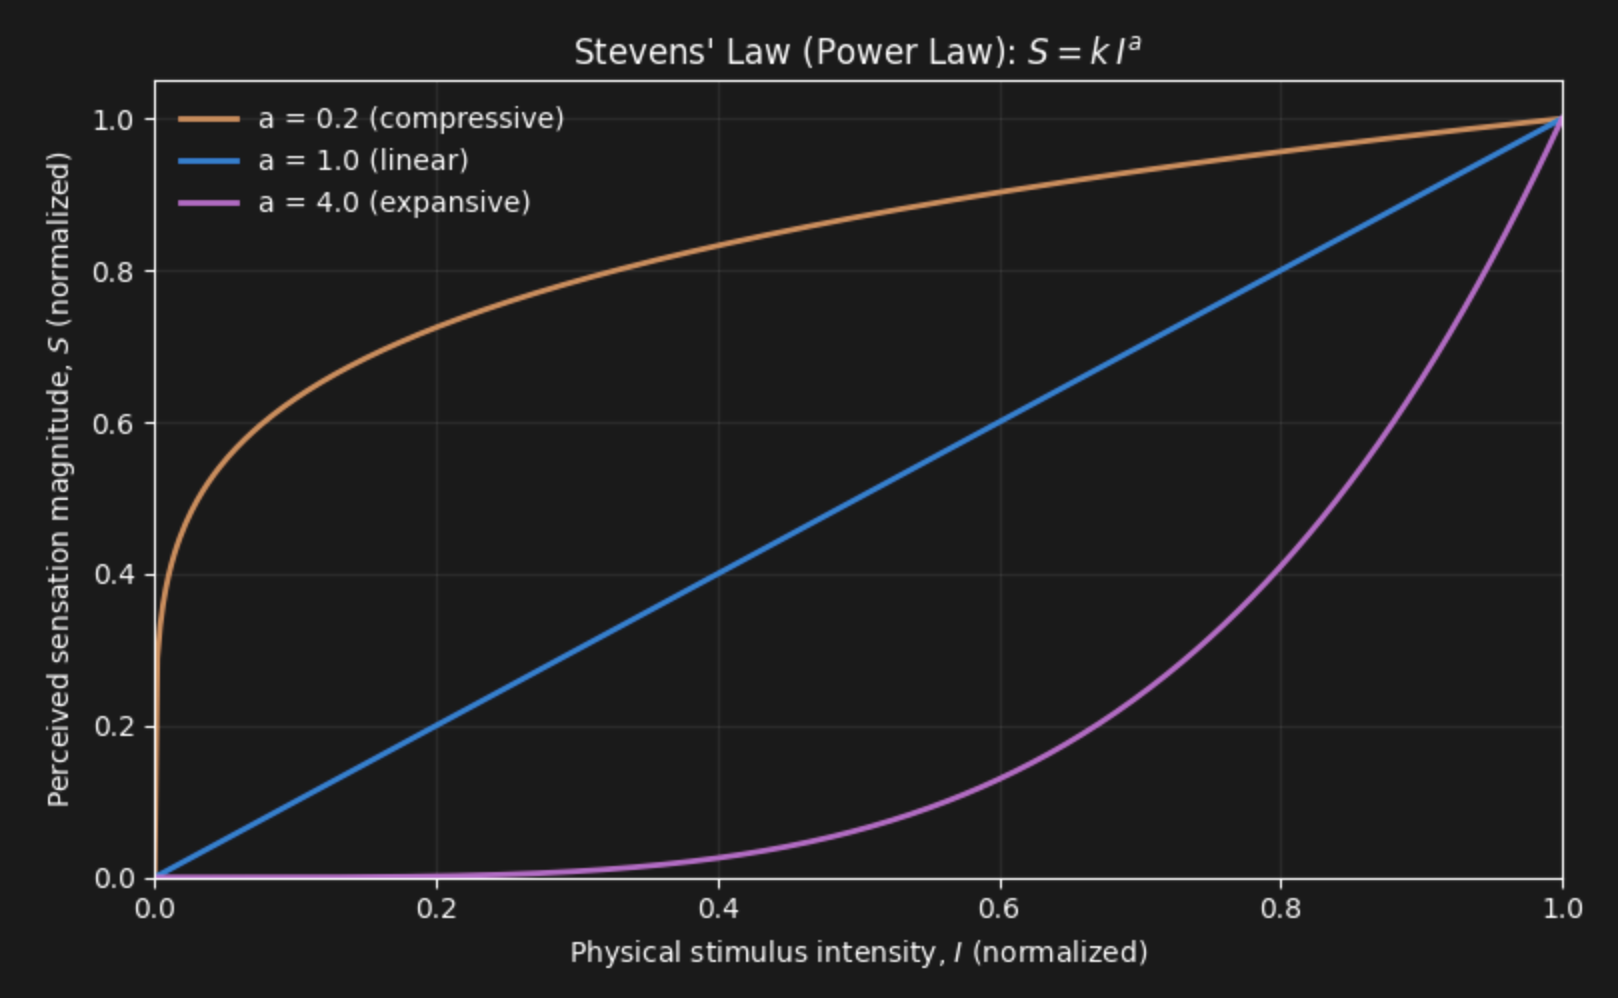
Figure 17:Steven’s Law is a short equation that explains psychophysical data that follows Weber’s Law, Fechner’s Law or exponential laws. It thus is the most simple and general rule that describes how perceptual intensity scales with stimulus intensity.
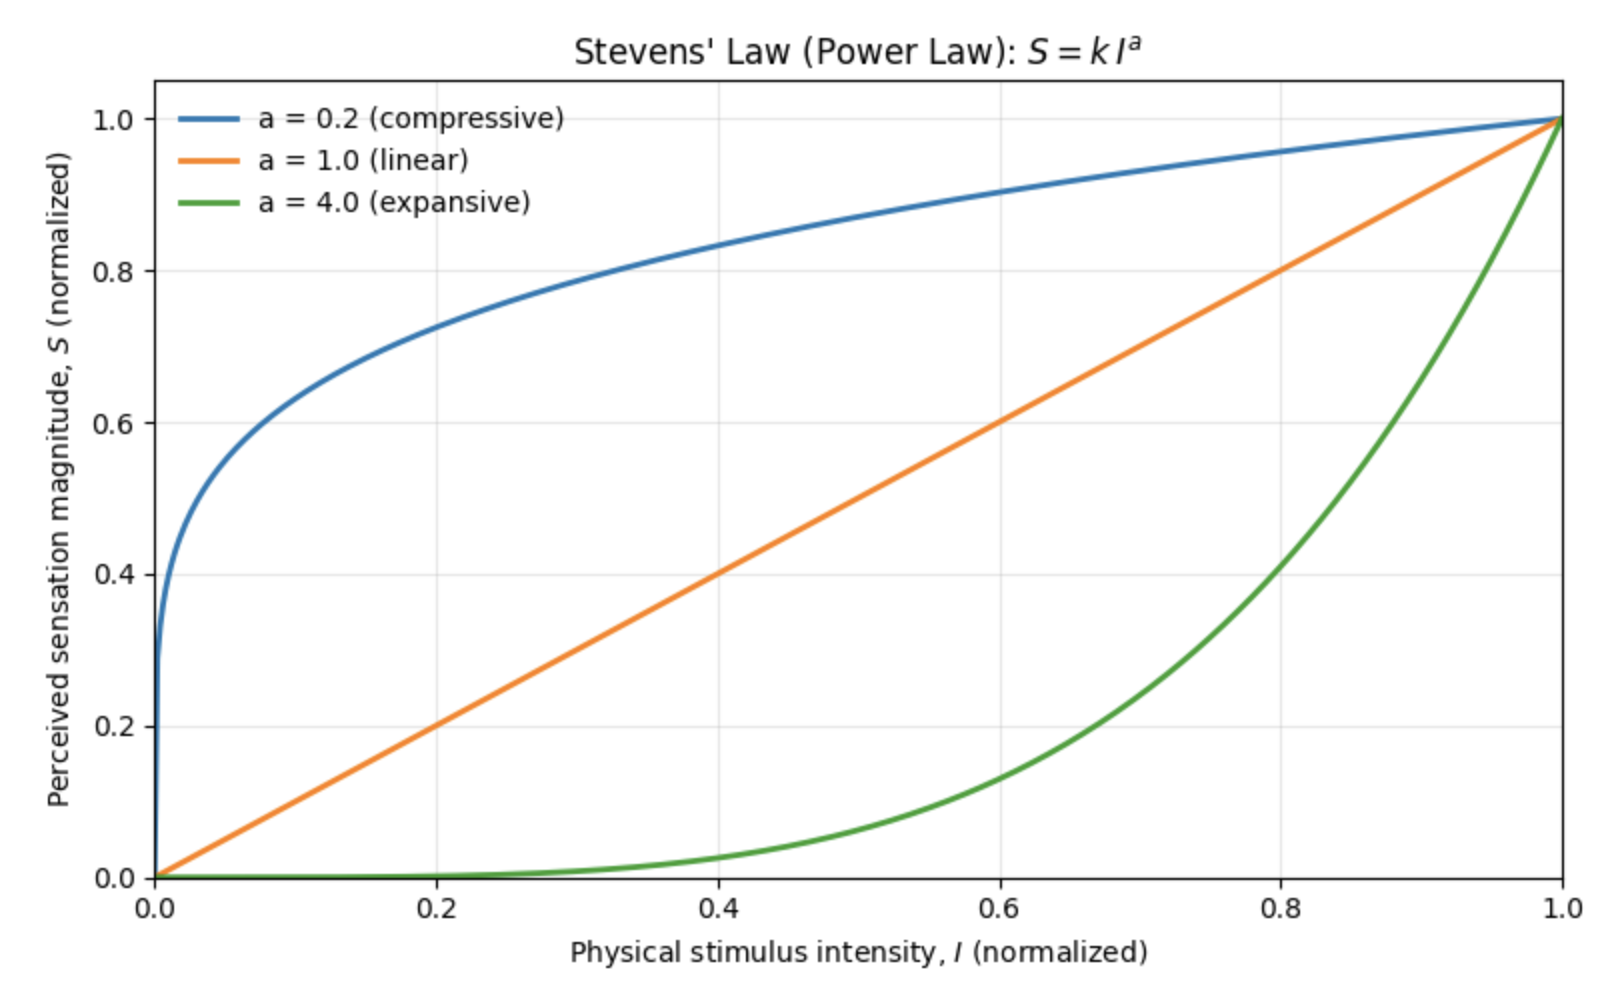
Figure 17:Steven’s Law is a short equation that explains psychophysical data that follows Weber’s Law, Fechner’s Law or exponential laws. It thus is the most simple and general rule that describes how perceptual intensity scales with stimulus intensity.